|
|
| search | feedback | |
| thriving organisations |
|
| governance | |
| planning | |
| evaluation | |
| quality improvement |
|
| evidence based practice |
|
| risk management | |
| writing
policy & organisational manuals |
|
| questionnaires | |
| data analysis | |
| social capital | |
| facilitation | |
| training workshops | |
| ideas & articles | |
| about us | |
| disclaimer | copyright | |
Management |

![]()
The You in Youth Survey
Findings: Upper Hunter Shire, Muswellbrook Shire and Singleton LGA
- The Report
- Introductory Video/webinar
The You in Youth Survey findings![]()
The YOU in YOUTH Survey is a survey of young people living in Upper Hunter Shire, Muswellbrook Shire and Singleton LGA.
The survey was completed in some schools by Year 7 to Year 11* students in Term 4 of 2012 and by the remaining schools by Year 7 to Year 12* students in Term 1 of 2013.
This report includes the findings from the survey. It is a resource for young people and anyone working with young people in the Upper Hunter Shire, Muswellbrook Shire and Singleton LGA.
The You in the Your Survey Findings includes extensive data in charts and tables.
This video/webinar (59 mins) includes:
1) A brief introduction to the Project, survey questions and contents of the Findings (Start at 0:0 mins)
2) A brief introduction to who's included in the survey, how representative they are of young people in the Upper Hunter and tips on using survey data. (Start at 5:56 mins)
3) An overview the the ways the data is presented including (Start at 13:29 mins):
A. Tables with percentages (one question at a time)
B. Bar charts of all responses (for one question at a time)
C. Line charts (showing the responses for a series of questions for different sub groups).
There are three kinds
Percentages
Averages
Standard deviations
D. Tables (showing the relationship between two questions simultaneously)
E. Stacked bar charts (showing the relationships between two questions simultaneously).
F. New variables (Start at 32:58)
G. Clusters of young people (Start at 35:35)
4) Walk through of question by question charts and tables and clusters charts ( Start at 43:57 mins)
If you only want to view part of the video/webinar you can jump to the start of the relevant section (see start times above).
After pressing play, choose High Definition 720p HD, in the video options on the bottom right, in order to make the lines, numbers and text in the webinar crystal clear.
Community Building: Muswellbrook
- The Report
- Introductory Video/webinar
This report Residents, Engagement and Community Building: Muswellbrook Opportunities for working together is intended as a resource for stakeholders to use in working together on community building. It is an invitation to collaborate in community building in Muswellbrook.
Attachment five of the Report is an Excel Spreadsheet that includes community profiles of LGAs, Suburbs and SA1 areas referred to in the Report.
Attachment 5. Demographics: Community Profiles (ABS) Excel Spreadsheet![]()
The Report Residents, Engagement and Community Building: Muswellbrook Opportunities for working together includes extensive data in maps, tables and a spreadsheet.
This video/webinar (33 mins) includes:
1) A brief introduction to the Project and the contents of the Report. (Start at 0:00 mins)
2) A introduction to the MAPS in the body of the report (Start at 4:04 mins)
3) An overview of the Maps in Attachment 3. Demographics: Maps (ABS) (Start at 17:53 mins)
4) A walk through of the tables in Attachment 4: Demographics: Tables (ABS) (Start at 18:41 mins)
5) A walk through of the community profiles in the spreadsheet Attachment 5. Demographics: Community Profiles (ABS). (Start at 24:10 mins)
If you only want to view part of the video/webinar you can jump to the start of the relevant section (see start times above).
After pressing play, choose High Definition 720p HD, in the video options on the bottom right, in order to make the lines, numbers and text in the webinar crystal clear.
Children's Services Strategic Planning: Muswellbrook
Muswellbrook Shire Children's Services Strategic Plan 2013 to 2015 ![]()
This strategic plan is a collaborative plan for children’s services stakeholders in the Muswellbrook Shire and Aberdeen. The plan has been developed in consultation and collaboration with Children’s Services stakeholders including Muswellbrook Shire Council, Long Day Care Centres, Family Day Care, Preschools, Primary Schools, Community Health Services, Upper Hunter Community Services and other community services, Government Departments, local families and young people and others.
The plan and recommendations are for consideration of these stakeholders. This strategic plan can only be implemented if the children’s services stakeholders work together on the implementation
Muswellbrook Town Maps
The following maps are taken from: Residents, Engagement and Community Building: Muswellbrook Opportunities for working together October 2013
- Maps
- Muswellbrook location
- Population
- Same residence in 2006
- Volunteers
- One parent families
- Public housing
- Indigenous Households
- Income > $2,500/week
- No motor vehicles
- SEIFA: Social disadvantage
- SEIFA: Advantage and disadvantage
- SEIFA: Education and occupation
- SEIFA: Economic resources
These maps are taken from: Residents, Engagement and Community Building: Muswellbrook Opportunities for working together October 2013
Muswellbrook location: situations Muswellbrook within Australia and NSW.
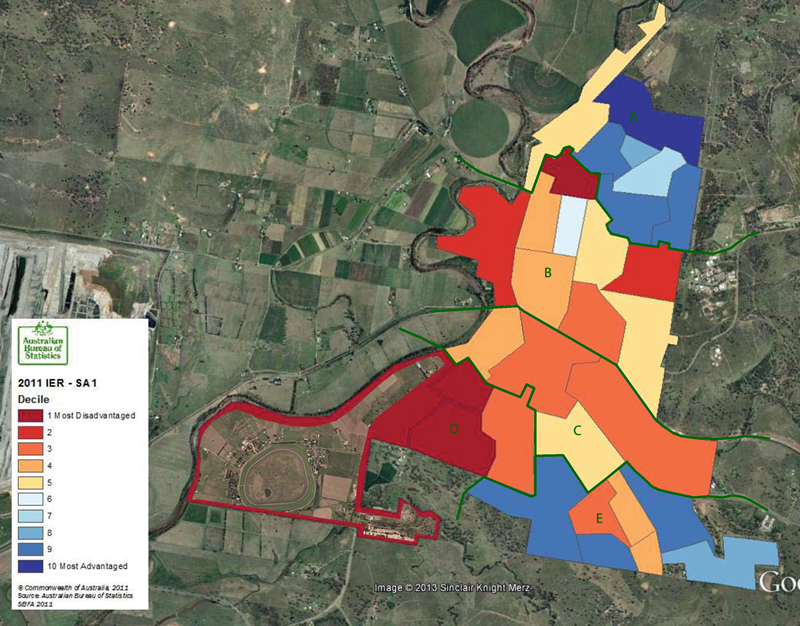
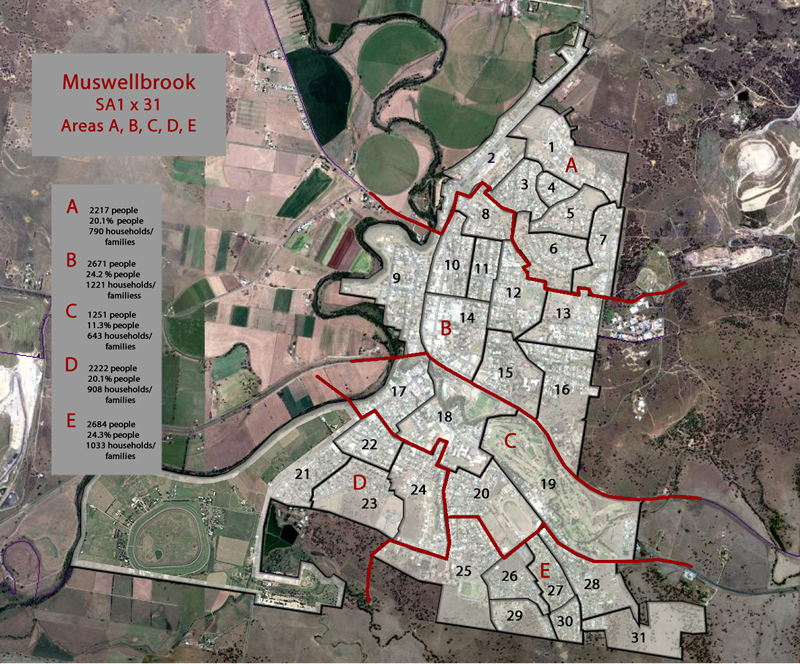
All the other maps show demographic data for Muswellbrook Town, the five Areas A,B,C,D and E used in the report and the 31 SA1 on which they are based.
Muswellbrook
Location: Muswellbrook is in Australian in the state of New South Wales. It is a three hour drive north from Sydney. It is 130km north-west of Newcastle.
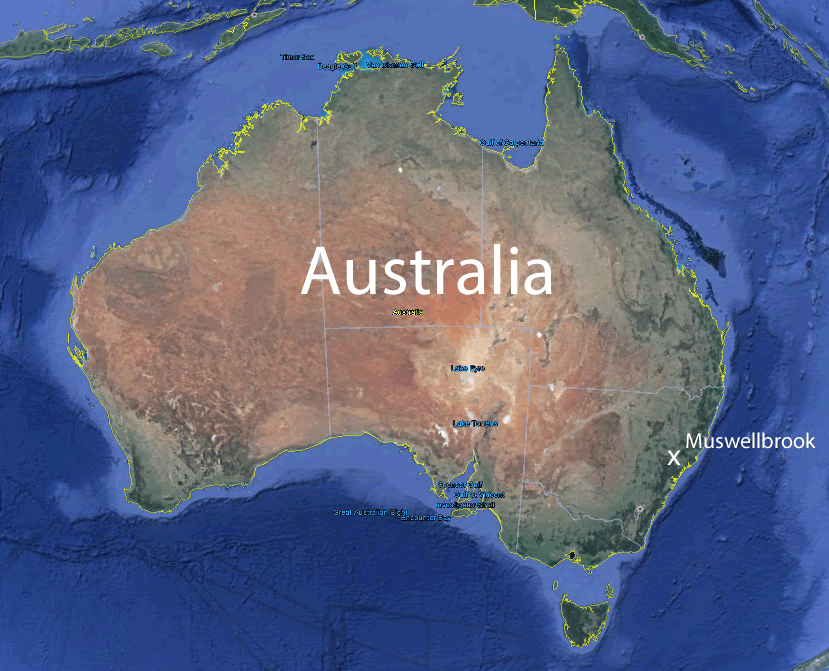
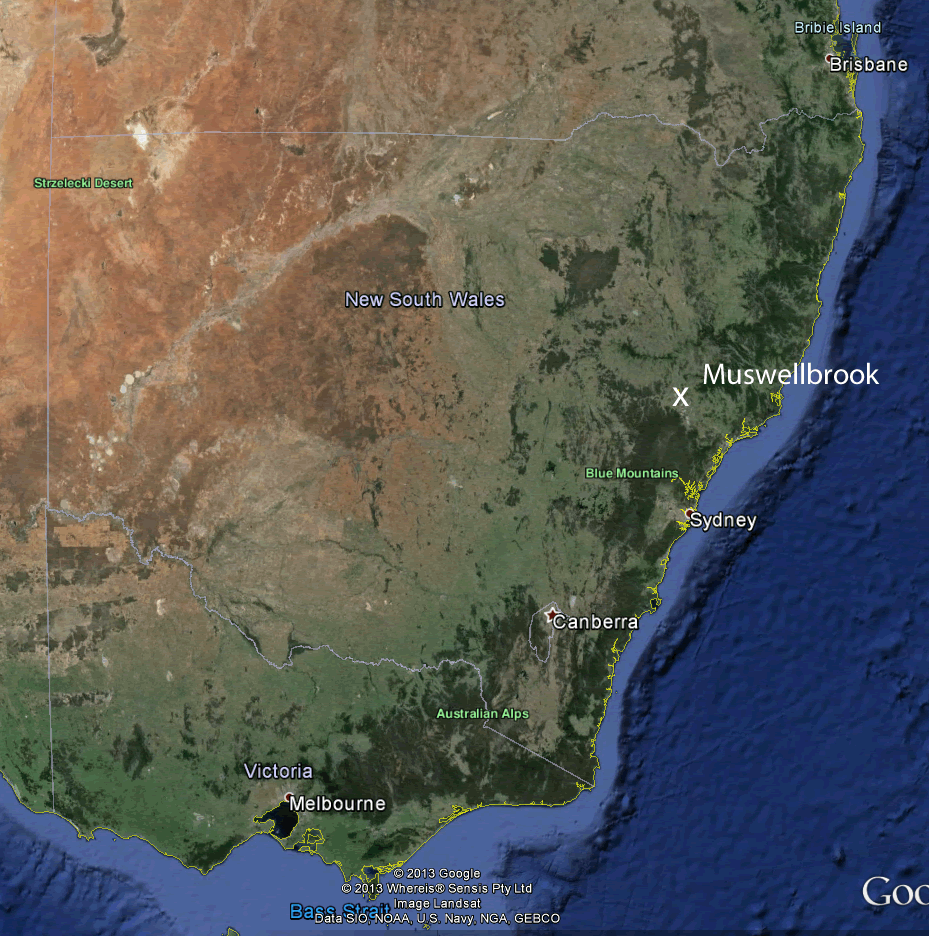
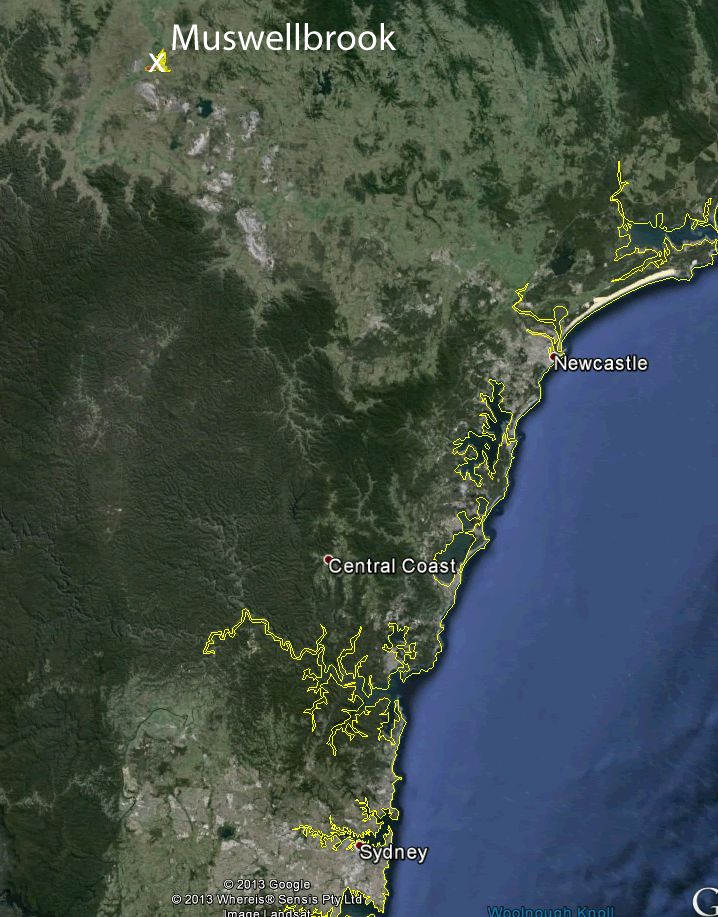
Maps images from Google Earth.
History
Muswellbrook was declared a township in 1833 (Muscle Creek).
By 1840 the population was 215. The rich soils in Muswellbrook allowed it to become a farming centre. Coal mining began in the 1890s.
By 1947 Muswellbrook town’s population was 3,939 and in 1996 the population of Muswellbrook Shire was 15,562.
In 2011 industry in Muswellbrook Shire included agriculture, viticulture, equine, power generation and coal mining.
In 2011 the community had 15,791 residents in Muswellbrook Shire and 11,791 residents in town.
Growth
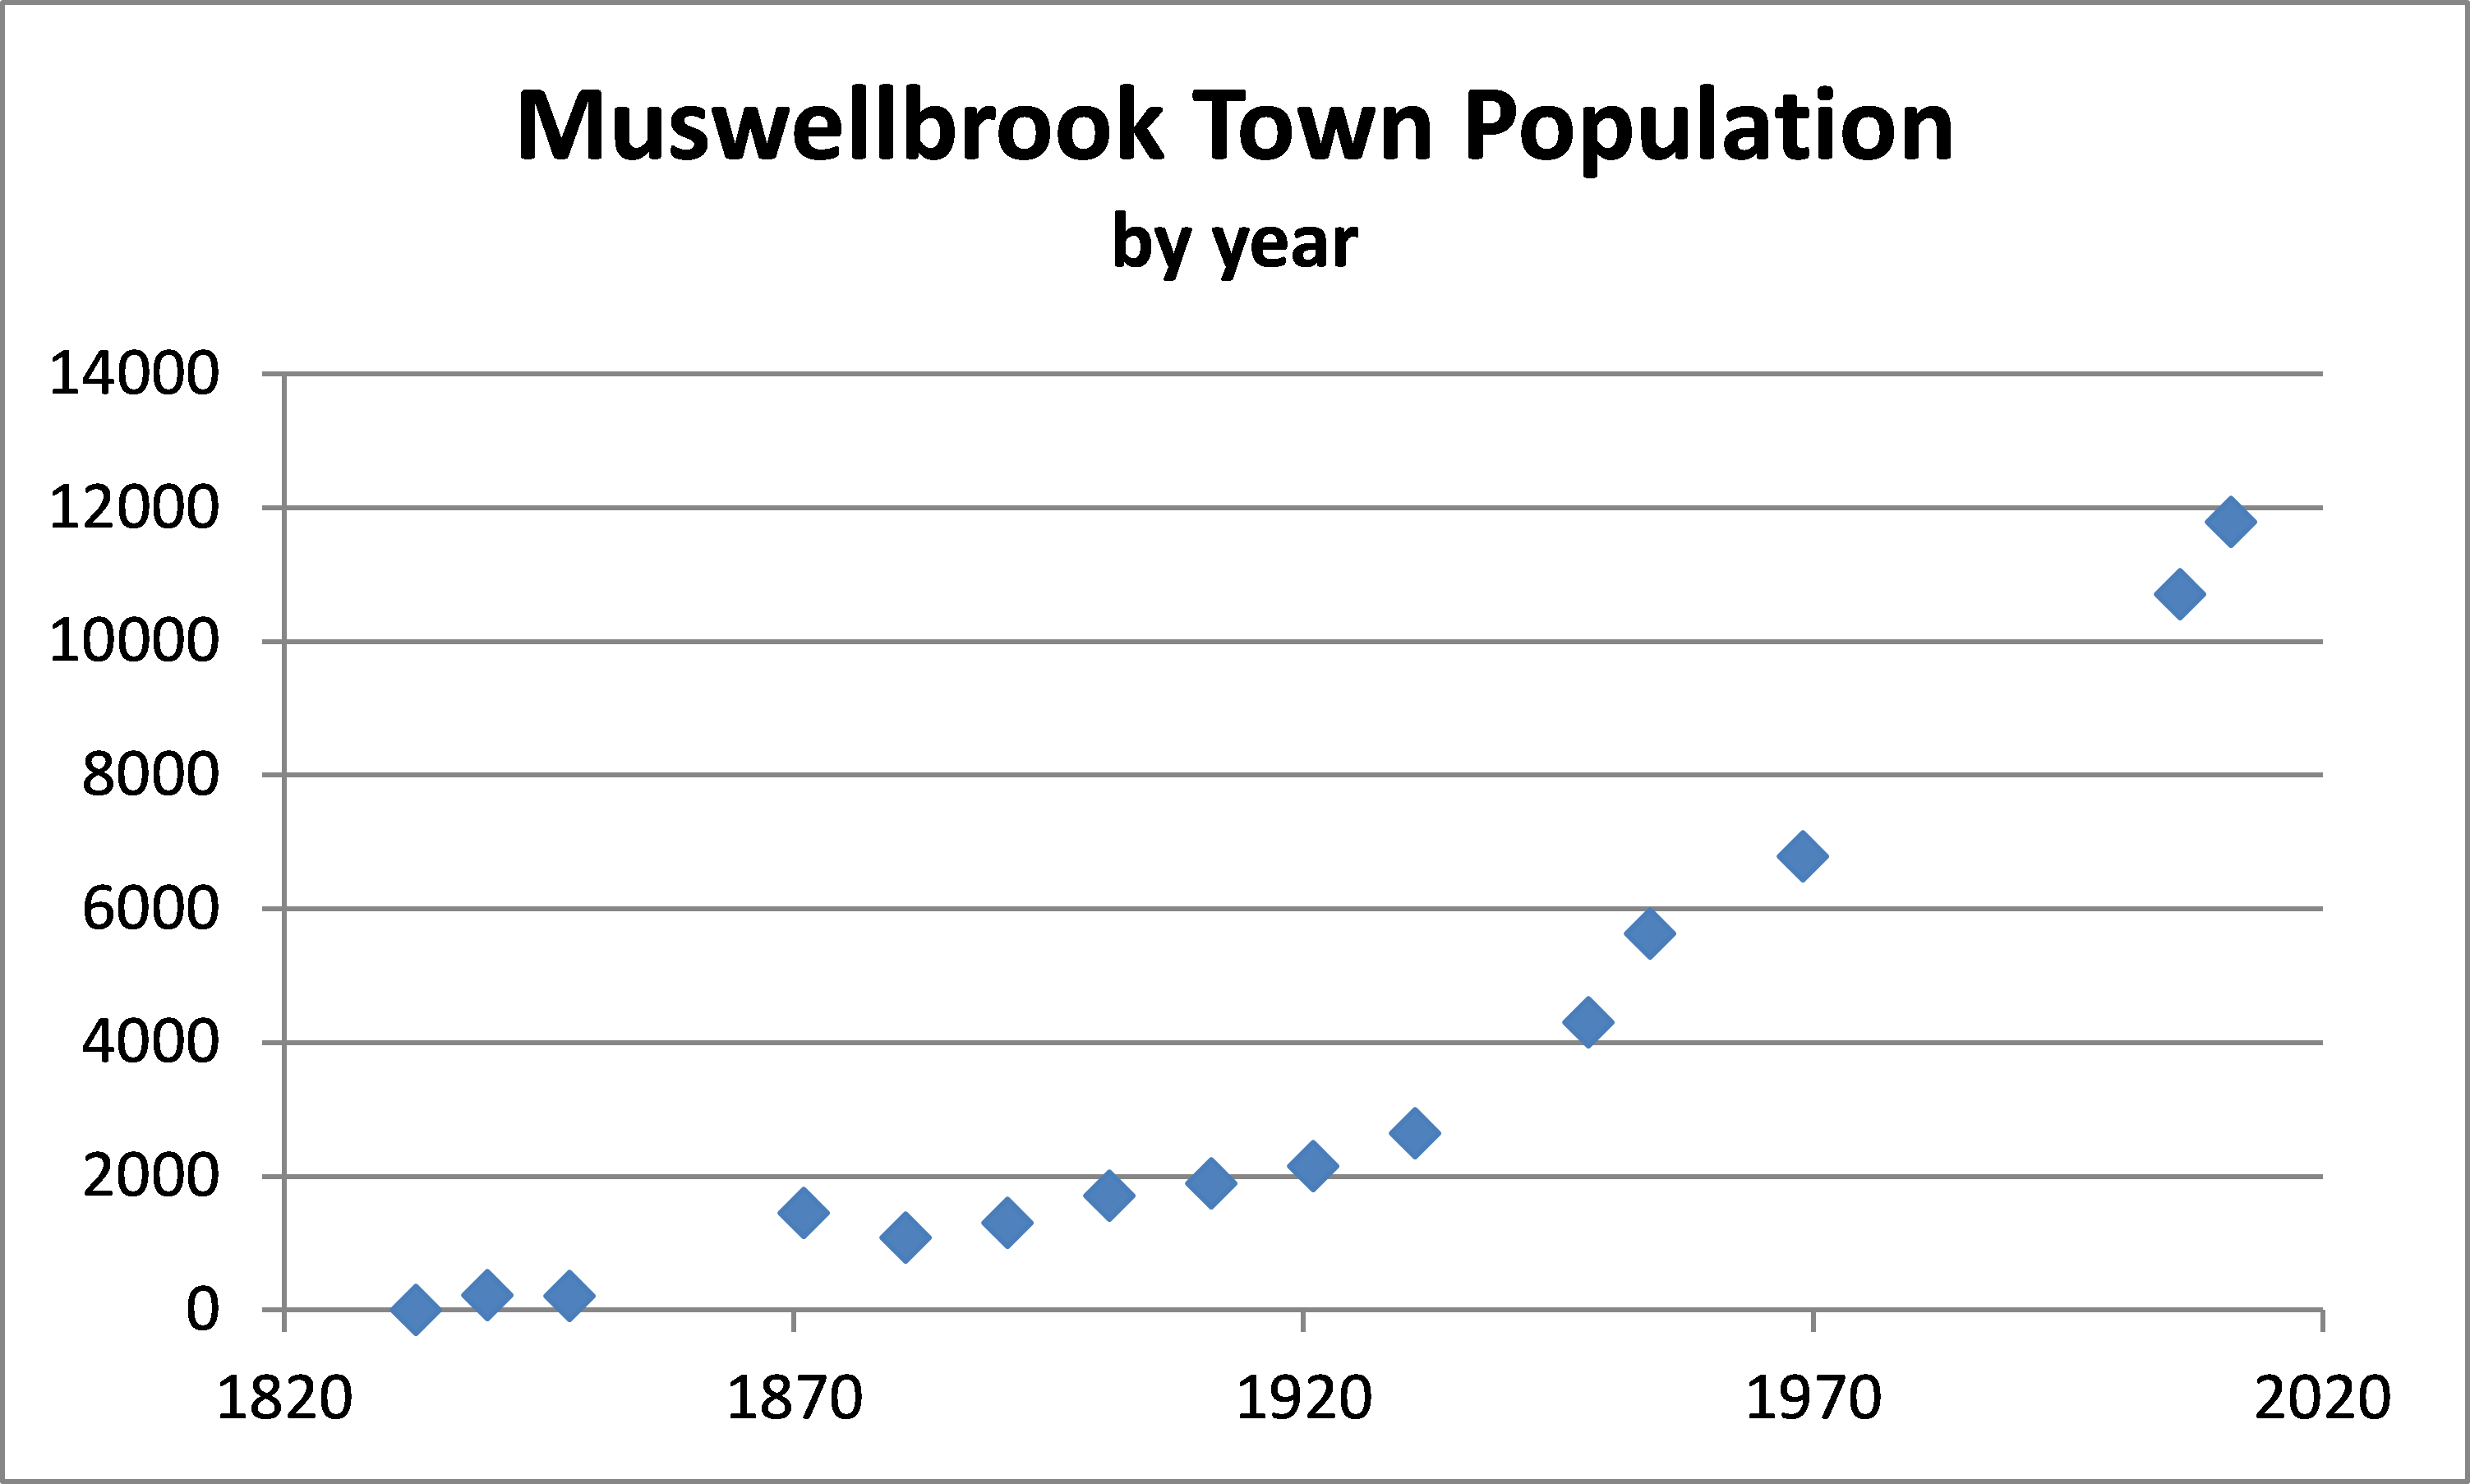
The Town
From Google Earth
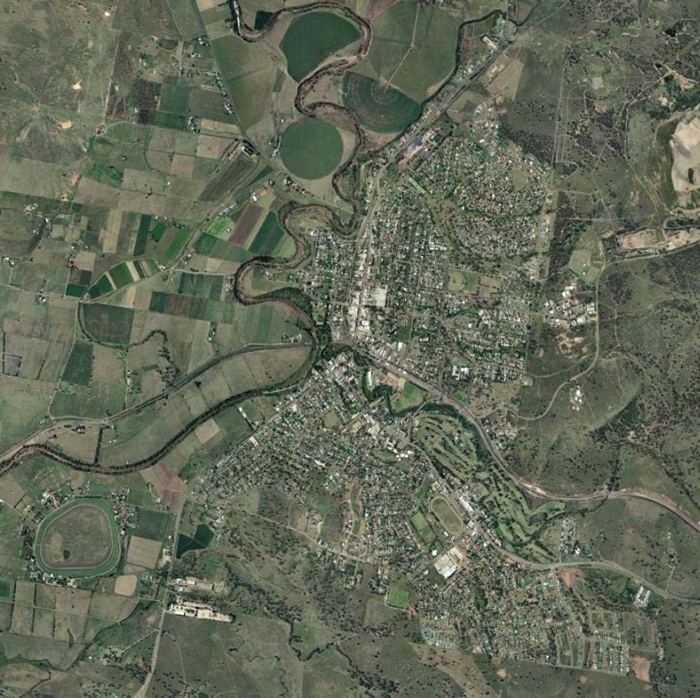
In 2011 the community had 11,791 residents in town.
Muswellbrook town is made up of 31 SA1s.
An SA1 is Statistical Area Level 1, the smallest area for which the Australian Bureau of Statistics (ABS) provides detailed demographic data.
All the demographic data in the maps in these conversation starters are from is from ABS data.
The 31 SA1s for Muswellbrook town each includes several hundred residents. There SA1s have been grouped into five areas, Areas A, B, C, D, and E.
The map below shows the SA1s and the way they are grouped into Areas A, B, C, D, and E.
The percentage of people who were at the same residence in 2011 as they were in 2006.
Nearly a half or more of the population in most SA1s was at a different residence in 2011 compared with 2006.Note the proportion of people in NSW at the same residence 5 years ago is 53% and the proportion at the same residence 1 year ago is 80%.
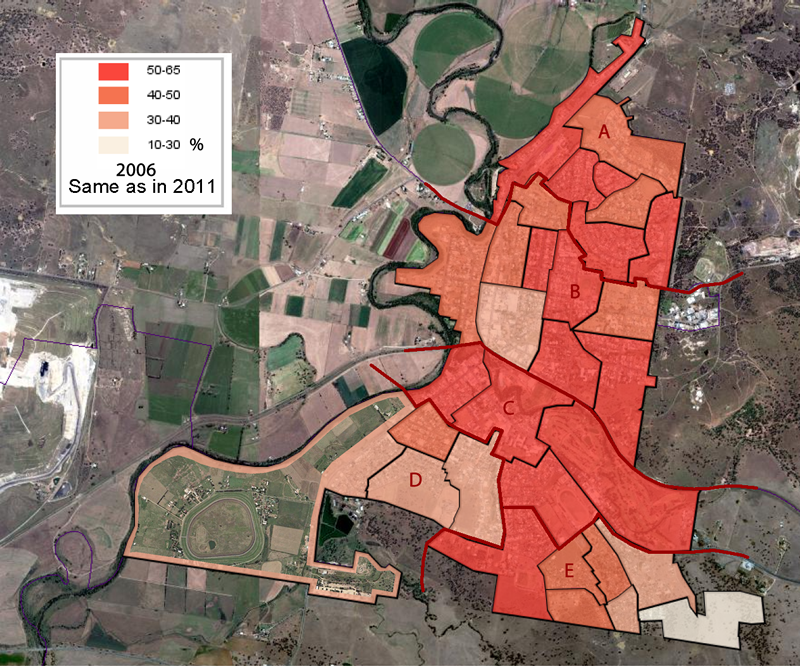
Data from Australian Bureau of Statistics (ABS)
The percentage of people who have volunteered in the past 12 months (as a percentage of the total population).
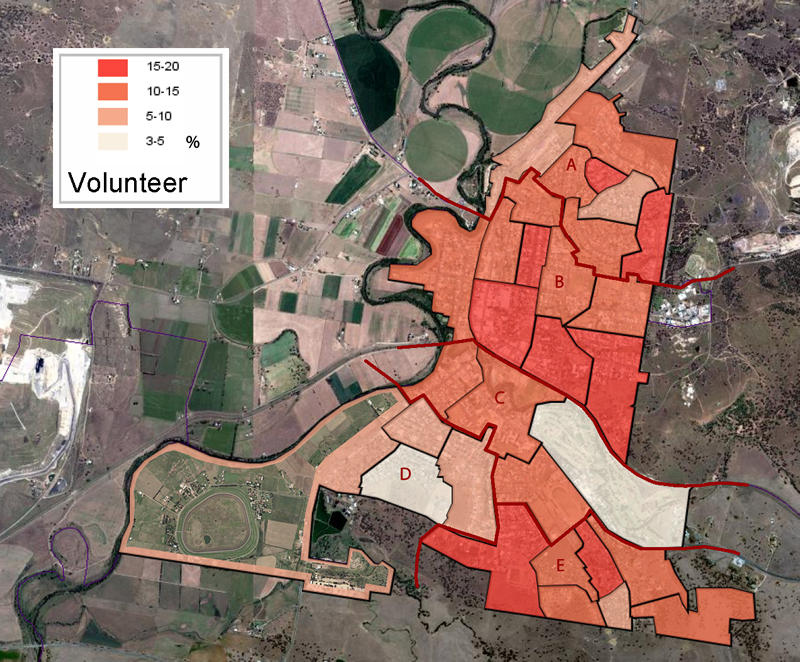
Data from Australian Bureau of Statistics (ABS)
The number of one parent families in each SA1.
Note that the population of areas A,B,D and E are each about 20% to 25% of the population. Area C is about 10% of the population.While some SA1s have greater numbers of single parents; single parents are throughout the whole of Muswellbrook in each SA1.
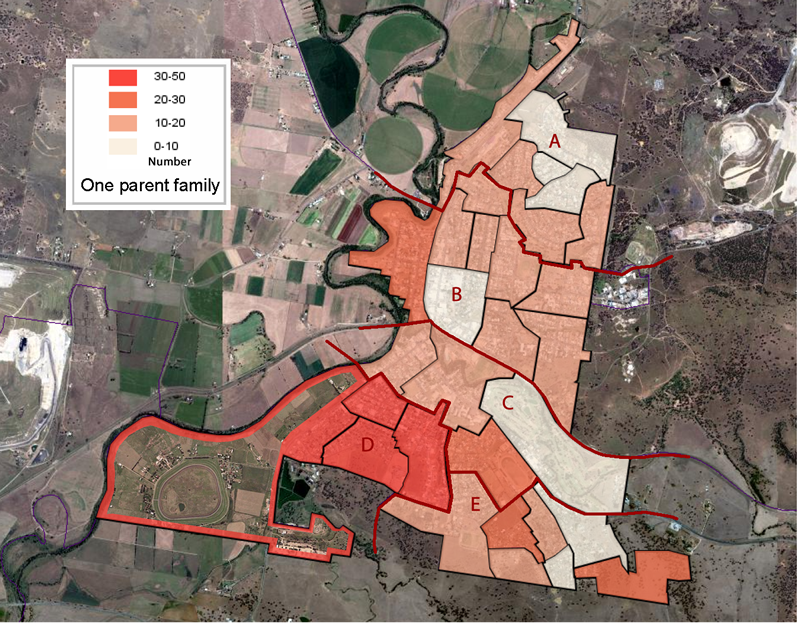
Data from Australian Bureau of Statistics (ABS)
This map shows the location and number of state public housing dwellings.
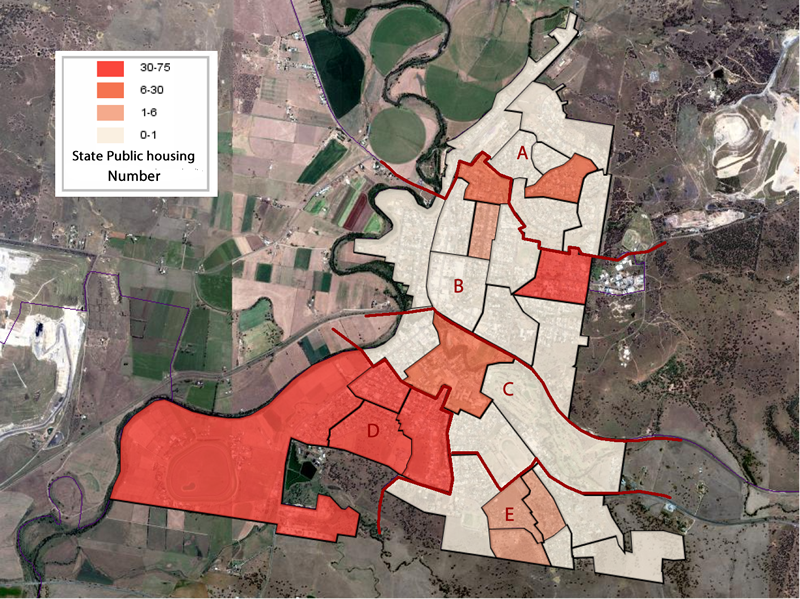
Data from Australian Bureau of Statistics (ABS)
The number of households with indigenous persons.
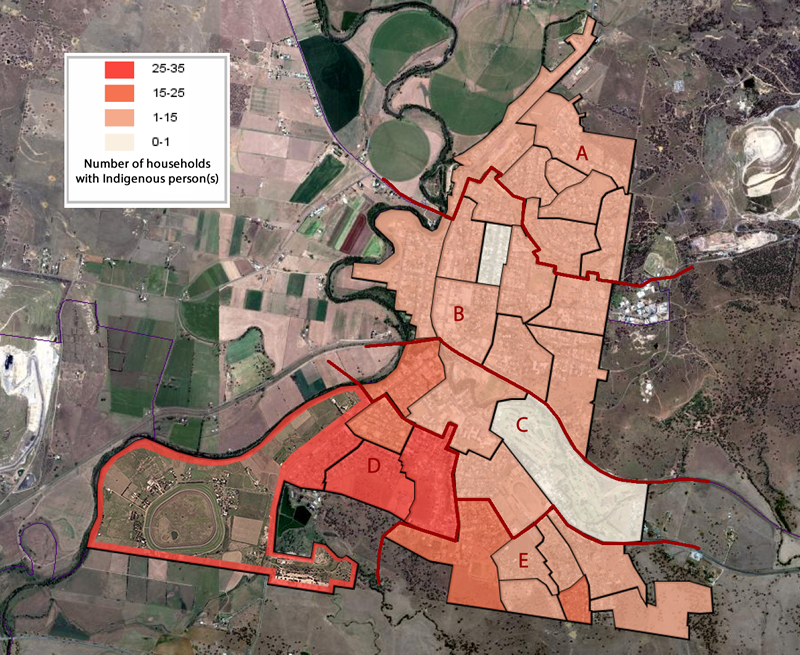
Data from Australian Bureau of Statistics (ABS)
The percentage of families with family income greater than $2500 per week.
Families include couples, couples with children and one parent families with children. (Lone person households, group households, etc. are not included.)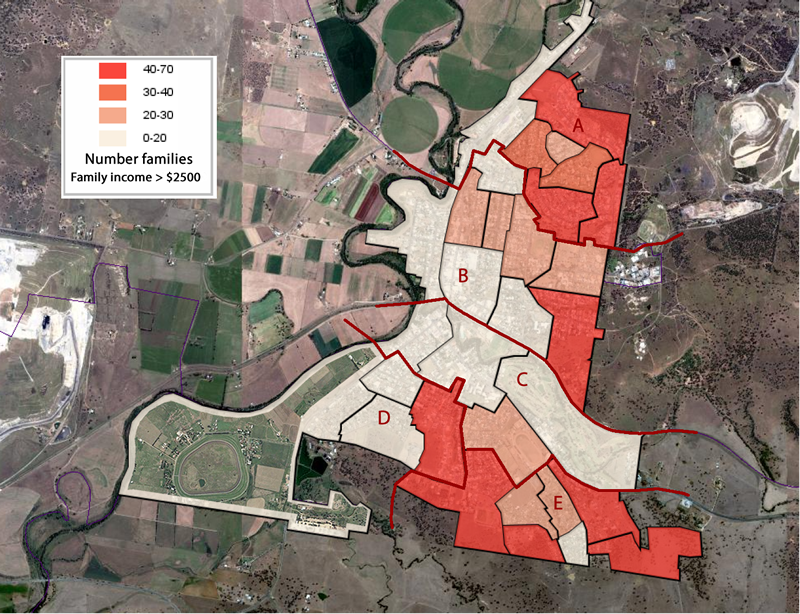
Data from Australian Bureau of Statistics (ABS)
The number of households where there are no motor vehicles.
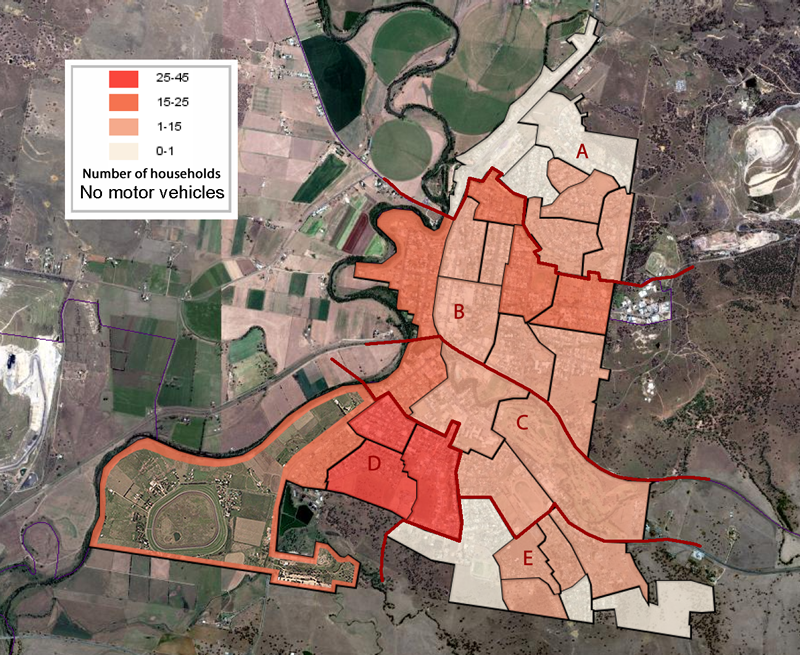
Data from Australian Bureau of Statistics (ABS)
Socio-Economic Indexes for SEIFA
The ABS has developed Socio-Economic Indexes for Areas (SEIFA).
SEIFA 2011 consists of the same four indexes that were produced for SEIFA 2006 and 2001:
Index of Relative Socio-economic Disadvantage (IRSD),
Index of Relative Socio-economic Advantage and Disadvantage (IRSAD),
Index of Education and Occupation (IEO), and
Index of Economic Resources (IER).
The indexes are assigned to areas, not to individuals. They indicate the collective socio-economic characteristics of the people living in an area. The indexes are best interpreted as a way of ranking areas.
Each index is constructed based on a weighted combination of selected variables (e.g. income, employment, education etc.). They are used to compare areas at a point in time.
Deciles – All SA1 areas are ordered from lowest to highest score, the lowest 10% of areas are given a decile number of 1, the next lowest 10% of areas are given a decile number of 2 and so on, up to the highest 10% of areas which are given a decile number of 10. This means that areas are divided up into ten equal sized groups. Deciles are used on the Maps.
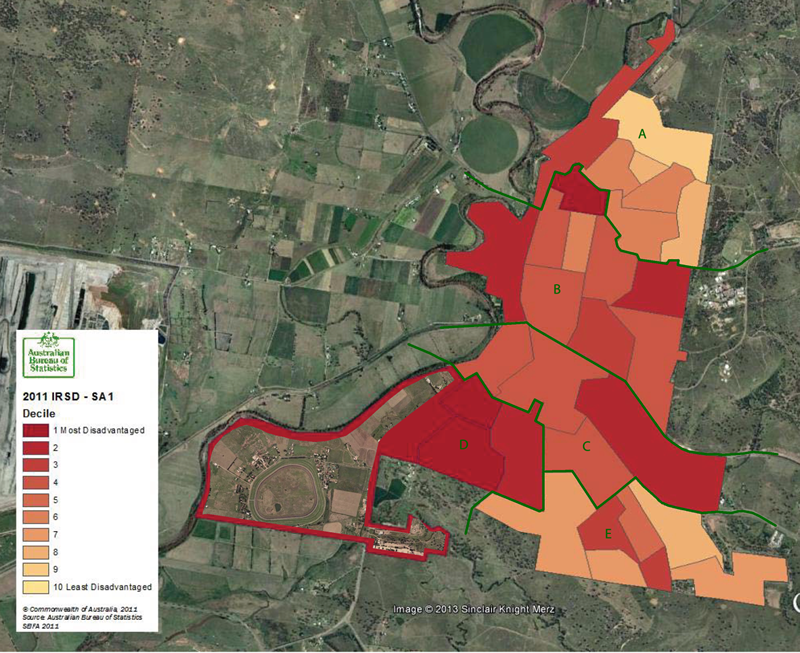
The Index of Relative Socio-Economic Disadvantage
The IRSD summarises variables that indicate relative disadvantage. This index ranks areas on a continuum from most disadvantaged to least disadvantaged.
A low score on this index indicates a high proportion of relatively disadvantaged people in an area. We cannot conclude that an area with a very high score has a large proportion of relatively advantaged (‘well off’) people, as there are no variables in the index to indicate this. We can only conclude that such an area has a relatively low incidence of disadvantage.
In the map below note that all SA1s in Muswellbrook have some disadvantage.
Each of the Areas A, B, C,D and E have at least one SA1 with a rank of 5 or less (i.e. below the half-way point compared with NSW).
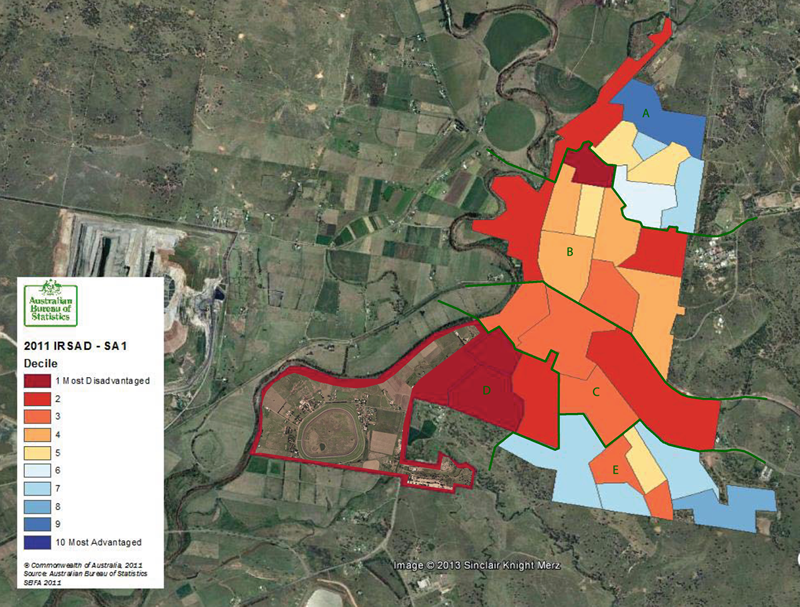
The Index of Relative Socio-Economic Advantage and Disadvantage
The IRSAD summarises variables that indicate either relative advantage or disadvantage. This index ranks areas on a continuum from most disadvantaged to most advantaged.
An area with a high score on this index has a relatively high incidence of advantage and a relatively low incidence of disadvantage. Due to the differences in scope between this index and the IRSD, the scores of some areas can vary substantially between the two indexes. For example, consider a large area that has parts containing relatively disadvantaged people, and other parts containing relatively advantaged people. This area may have a low IRSD ranking, due to its pockets of disadvantage.
However, its IRSAD ranking may be moderate, or even above average, because the pockets of advantage may offset the pockets of disadvantage.
In the map below note that most SA1s in Muswellbrook are red (ranked below half way in NSW) and a few are blue (ranked above half way in NSW).
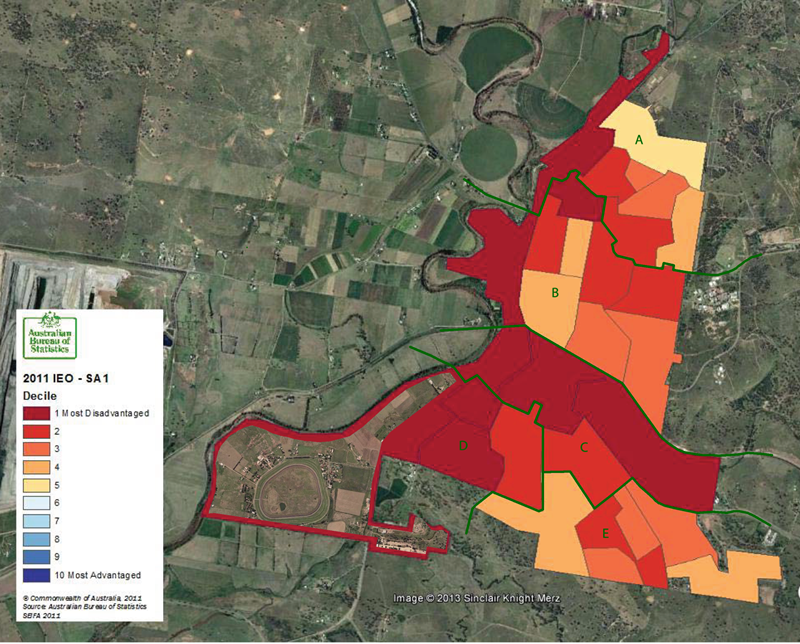
The Index of Education and Occupation
The IEO summarises variables relating to the educational and occupational aspects of relative socio-economic advantage and disadvantage. This index focuses on the skills of the people in an area, both formal qualifications and the skills required to perform different occupations.
A low score indicates that an area has a high proportion of people without qualifications, without jobs, and/or with low skilled jobs. A high score indicates many people with high qualifications and/or highly skilled jobs.
In the map below note that ALL SA1s in Muswellbrook are red (ranked below half way in NSW) and none are blue (ranked above half way in NSW). Of the 31 SA1s there are 31 that rank 5 or less. There are 26 SA1s that rank 3 or less and they are in Areas A, B, C, D and E.
The Index of Economic Resources
The IER summarises variables relating to the financial aspects of relative socioeconomic advantage and disadvantage. These include indicators of high and low income, as well as variables that correlate with high or low wealth.
Areas with higher scores have relatively greater access to economic resources than areas with lower scores.
In the map below note that most SA1s in Muswellbrook are red (ranked below half way in NSW) and some are blue (ranked above half way in NSW).